
Overview #
This article describes how to access and use the Dashboards in IQNECT to analyze requirements across multiple projects. The Dashboards provide key performance indicators (KPIs) at different levels of detail: project-level, resource-shape-level, and individual-resource-level.
Use these views to evaluate project health, monitor trends, and understand quality metrics across a connected ALM environment such as Codebeamer.
Prerequisites #
- You have access to at least one Codebeamer project.
- You have permission to analyze items in selected trackers.
- Dashboard analysis is enabled for your IQNECT environment.
Open the dashboards #
You can access Dashboards from any IQNECT view.
From the IQNECT toolbar #
- Click the graph icon to open the Dashboards.
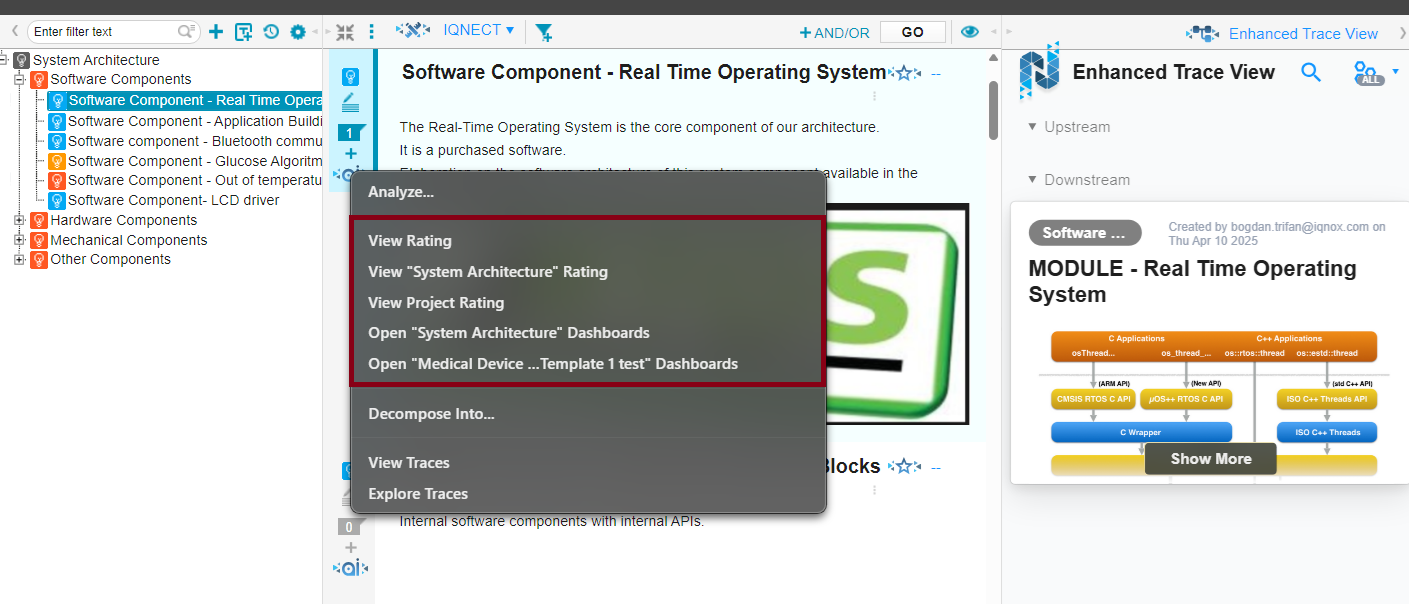
From any tracker item #
In document view:
- Use the IQNECT AI icon on the tracker toolbar.
- Use the AI icon on the item toolbar.
Selecting any resource in an IQNECT view also opens a popup version of the dashboard, which can be dragged and resized.

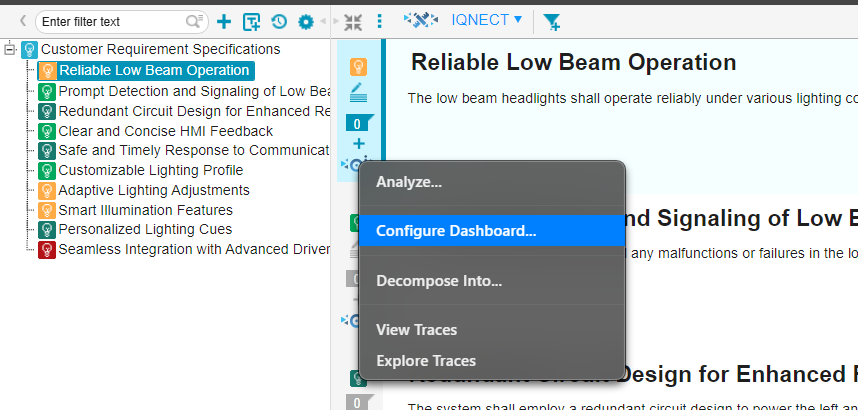
This system features three primary views: the Project View, the Resource Shape View, and the Resource View, each offering a progressively detailed level of information. They can also be accessed by clicking on any resource that is in an IQNECT view.
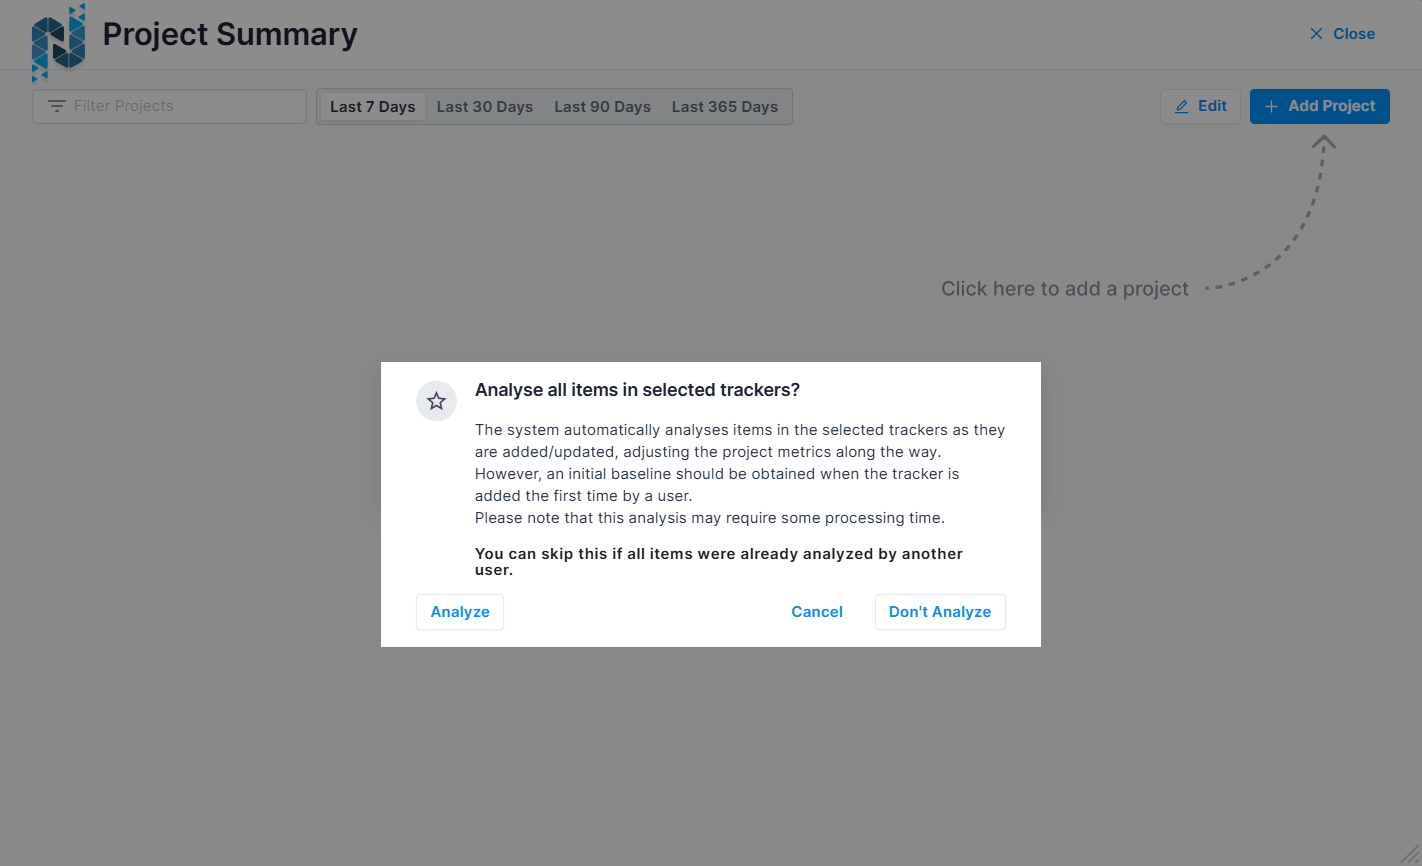
Analyze a tracker automatically #
When adding a project and tracker to the dashboard:
- Choose the tracker you want to analyze.
- A popup appears asking whether to analyze all items from the selected tracker.
- If confirmed, IQNECT automatically submits all items in the tracker for analysis without waiting for external triggers.
Project View #
The Project View displays a personalized summary of the projects you want to monitor.
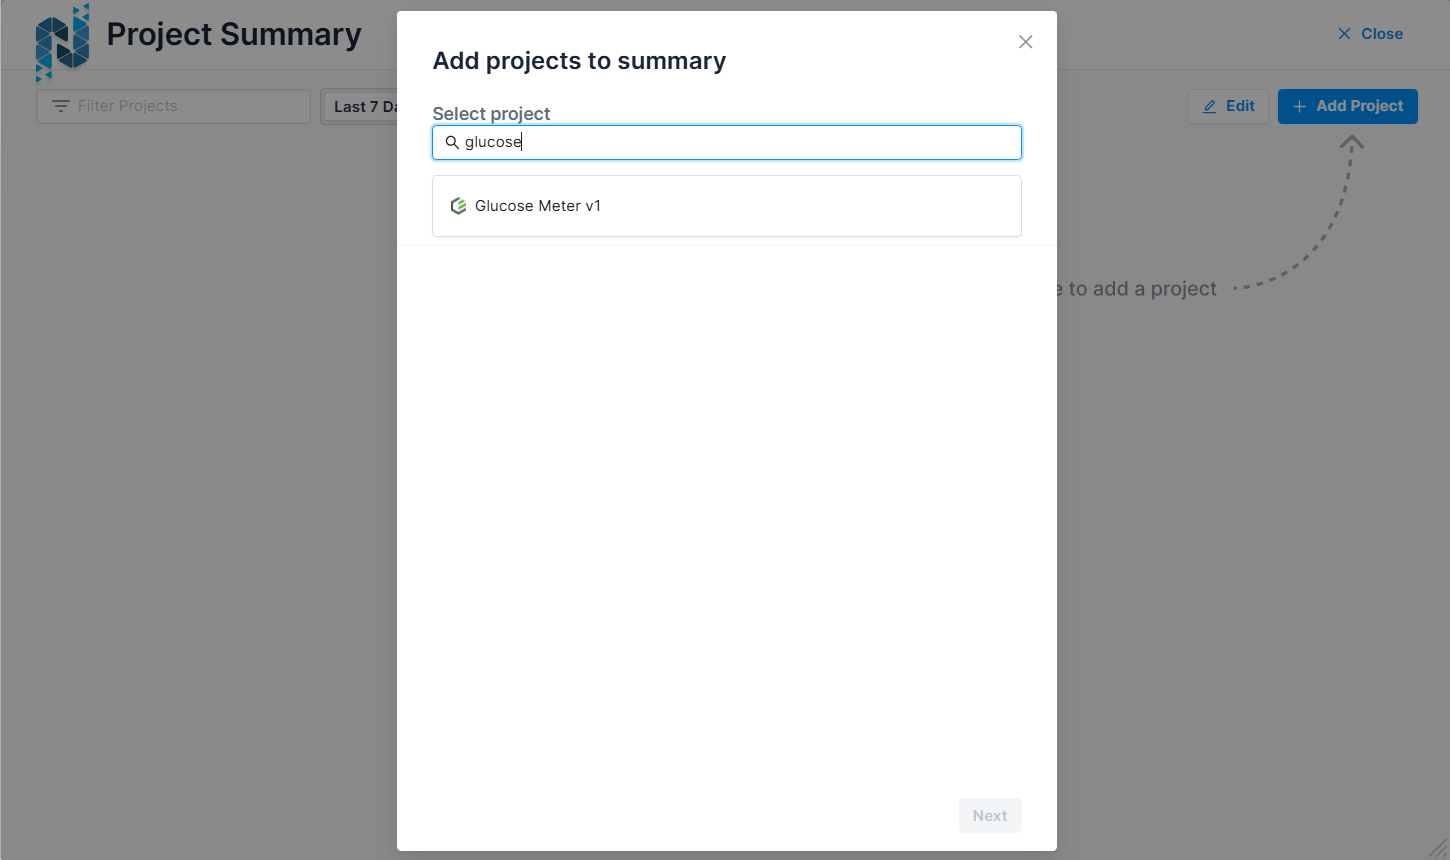
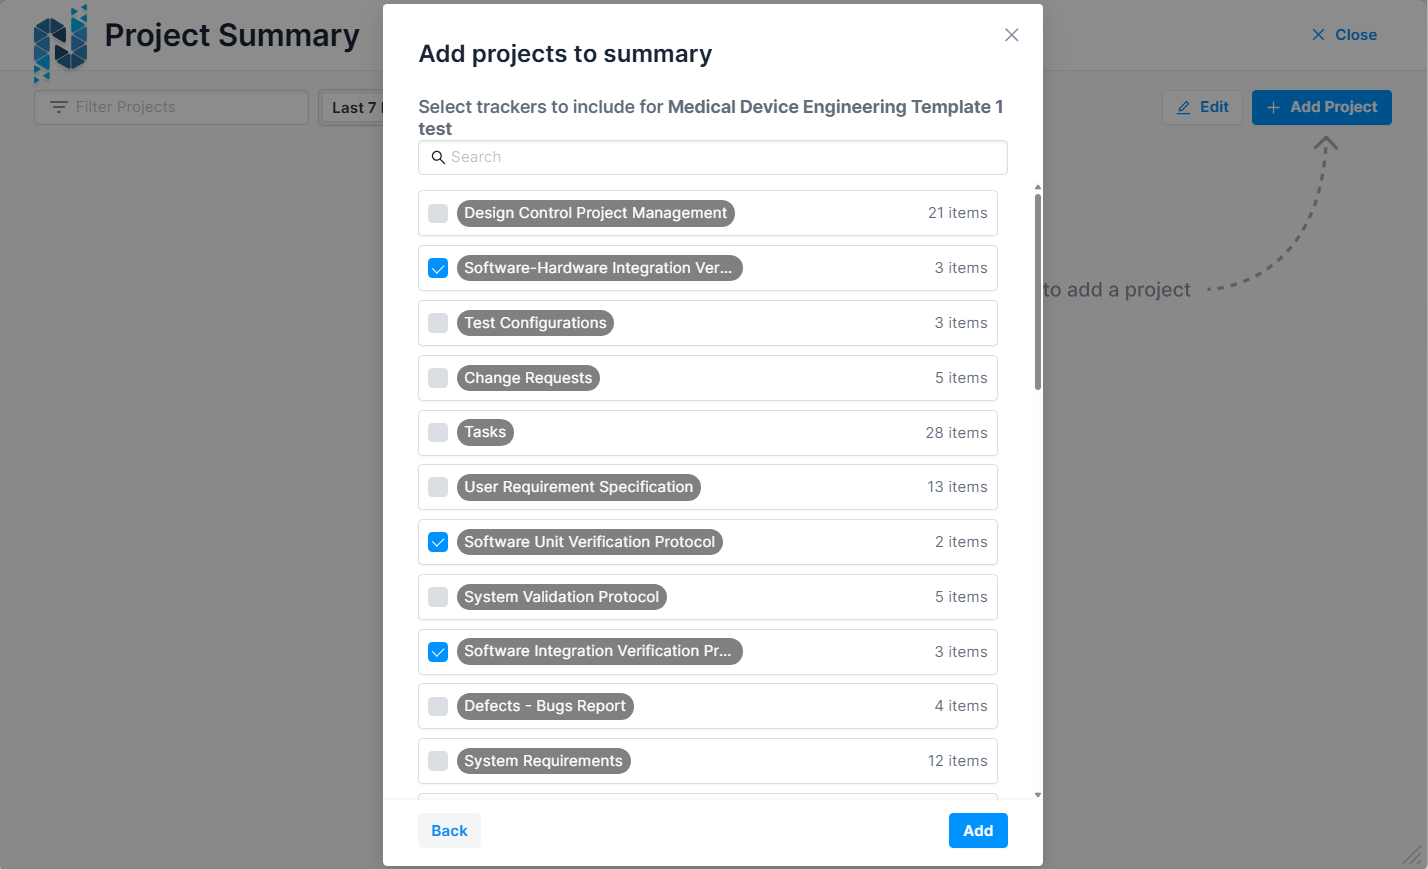
Add a project to the dashboard #
- Open the Project View.
- Select the option to add a project.
- In the popup, select any project available to you in Codebeamer that is not already on your dashboard.
- In the next popup, select the resource shapes you want included in the analysis for that project.
Different users can track different shapes for the same project.
Remove a project from the dashboard #
- Enter editing mode in the dashboard.
- Click the X button on any project card to remove it.
If all users remove a project, it stops being continuously analyzed on the backend.
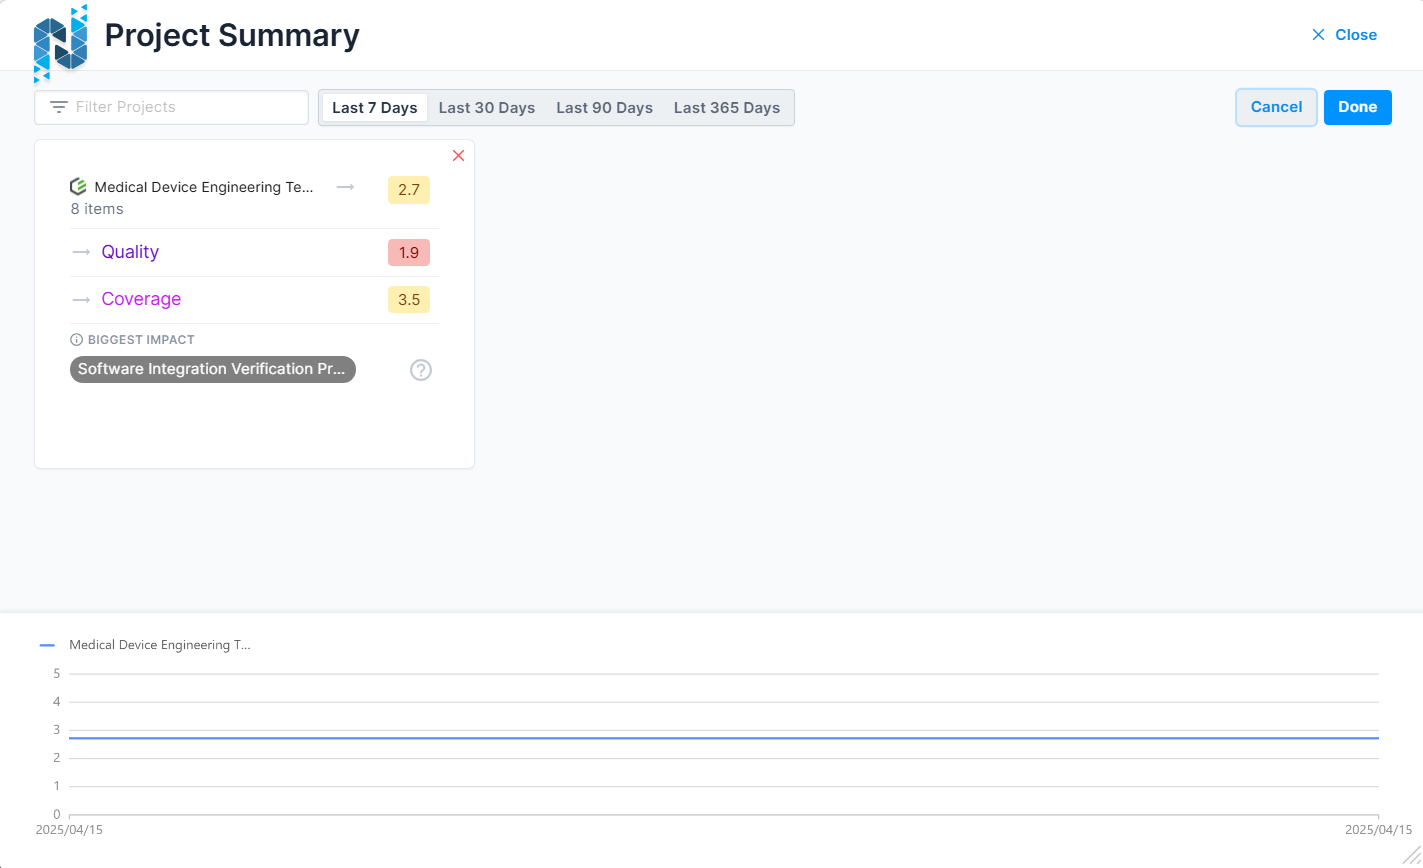
Use the time selector #
Above the project list, choose a time interval:
- Last 7 days
- Last 30 days
- Last 90 days
- Last 365 days
Filter projects #
Use the filter field above the project list to type a project name and narrow the visible cards.
Understand project cards #
Each project appears as a card with the following sections:
Header #
- System icon (Codebeamer)
- Project title
-
Total number of resources based on selected shapes
Trend icon for overall score
Optional status icons:
- Gray exclamation mark (archived or outdated)
-
Red broken link (sync failed)
Tooltips explain each status.
KPIs #
Each project card displays:
- Quality
- Duplicates
- Coverage
Each KPI includes:
- Trend icon
- KPI name
- Score (color-coded, configurable on the backend)
Footer #
Displays:
- The resource shape with the largest impact on the score
- The largest negative outlier
- An icon that shows selected shapes when hovered over
Score history chart #
Below the project cards, a chart displays the evolution of overall scores for all selected projects over the chosen interval.
Each line represents one project, with a legend indicating colors.
Newly added projects #
If a project is newly added and not yet synced:
- KPI areas are grayed out
- Trend icons are disabled
- Score values are replaced by dashes
Resource Shape View #
The Resource Shape View shows detailed analysis for all resource shapes in a selected project.
Open the Resource Shape View #
- Select a project from the Project View.
- The Resource Shape Dashboard loads with breadcrumb navigation to return to the Projects Dashboard.
- The previously selected time interval is retained.
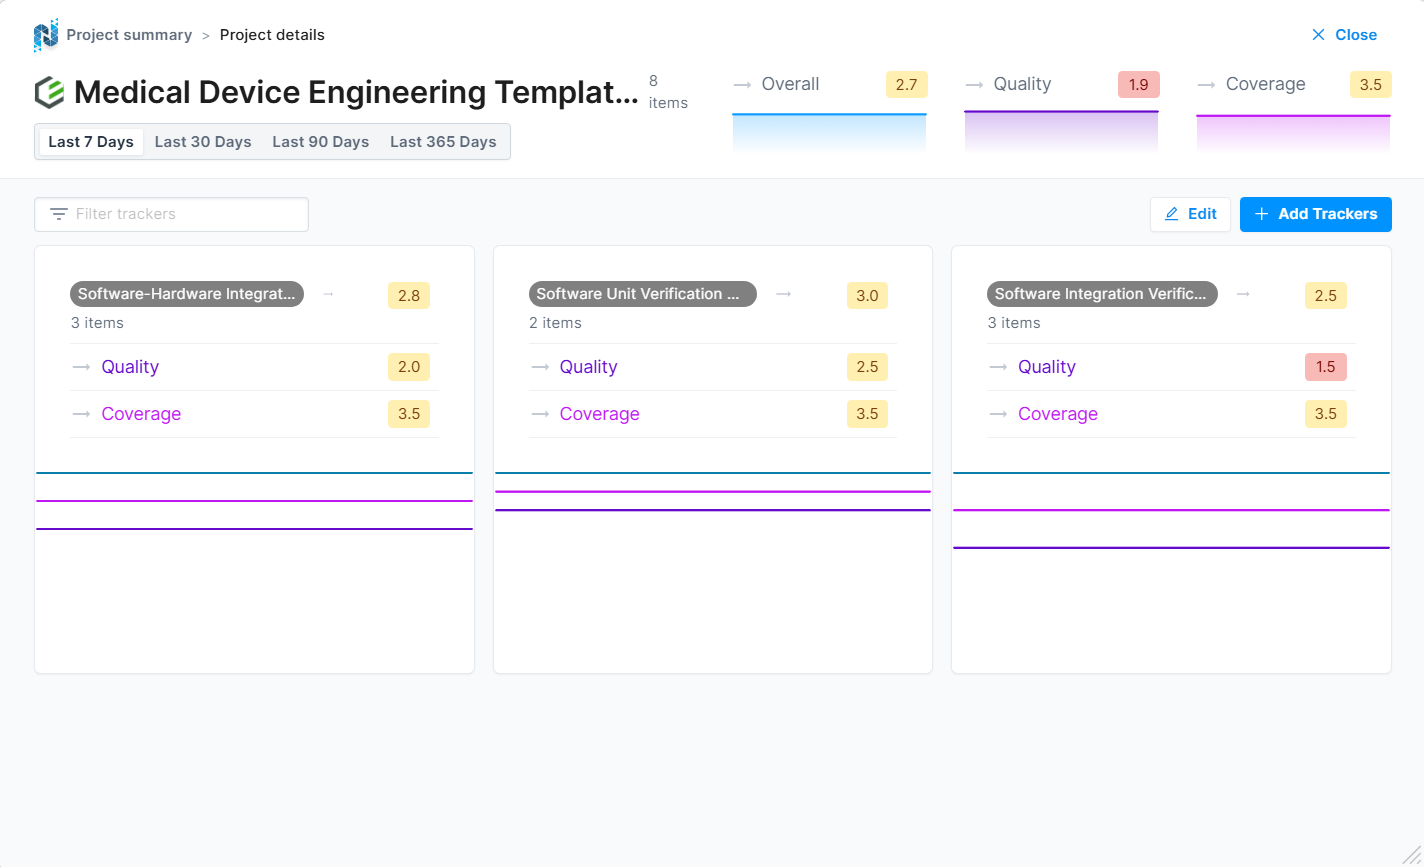
Understand the resource shape header #
A large horizontal header displays:
- System icon (Codebeamer)
- Project name
- Total number of resources
- Overall score
-
KPIs for quality, duplicates, and coverage
Each KPI includes:
- Trend icon
- KPI name
- Color-coded score
- Small trend chart for the selected time interval
Filter resource shapes #
Type in the filter field to narrow the list of shapes by name.
View resource shape cards #
Each card includes:
Header #
- Resource shape name
- Number of resources
- Trend icon for overall shape score
- Overall score (color-coded)
KPIs #
Mirrors the project-level structure:
- Quality
- Duplicates
- Coverage
Each with trend icon and score.
Footer #
- A chart showing KPI history for the selected interval
- Time axis corresponds to the interval
- Y-axis ranges from 0 to 5
- Hover reveals KPI values
Newly added shapes #
Un-synced shapes appear grayed out with placeholder dashes.
Add or remove resource shapes #
- Use the edit button to remove shapes (X icons appear on each card).
- Removing a shape here also removes it from the associated project dashboard.
- Use the add button to open a popup and select new resource shapes.
Selected shapes are added immediately and included in the project analysis.
Resource View #
The Resource Dashboards provide detailed insights into individual resources within a project. These dashboards are accessed by selecting a resource shape in the Resource Shapes Dashboard and offer a view of resource-specific metrics and trends. Key features include advanced filtering, sorting, and visualization options, all designed to help users drill down into resource-specific data effectively.
The Resource View provides detailed metrics for each resource under a selected resource shape.
Open the Resource View #
- Select a resource shape from the Resource Shape Dashboard.
- Breadcrumbs appear at the top of the screen:
- Back to Resource Shapes
- Back to Projects
- Time selection is retained.
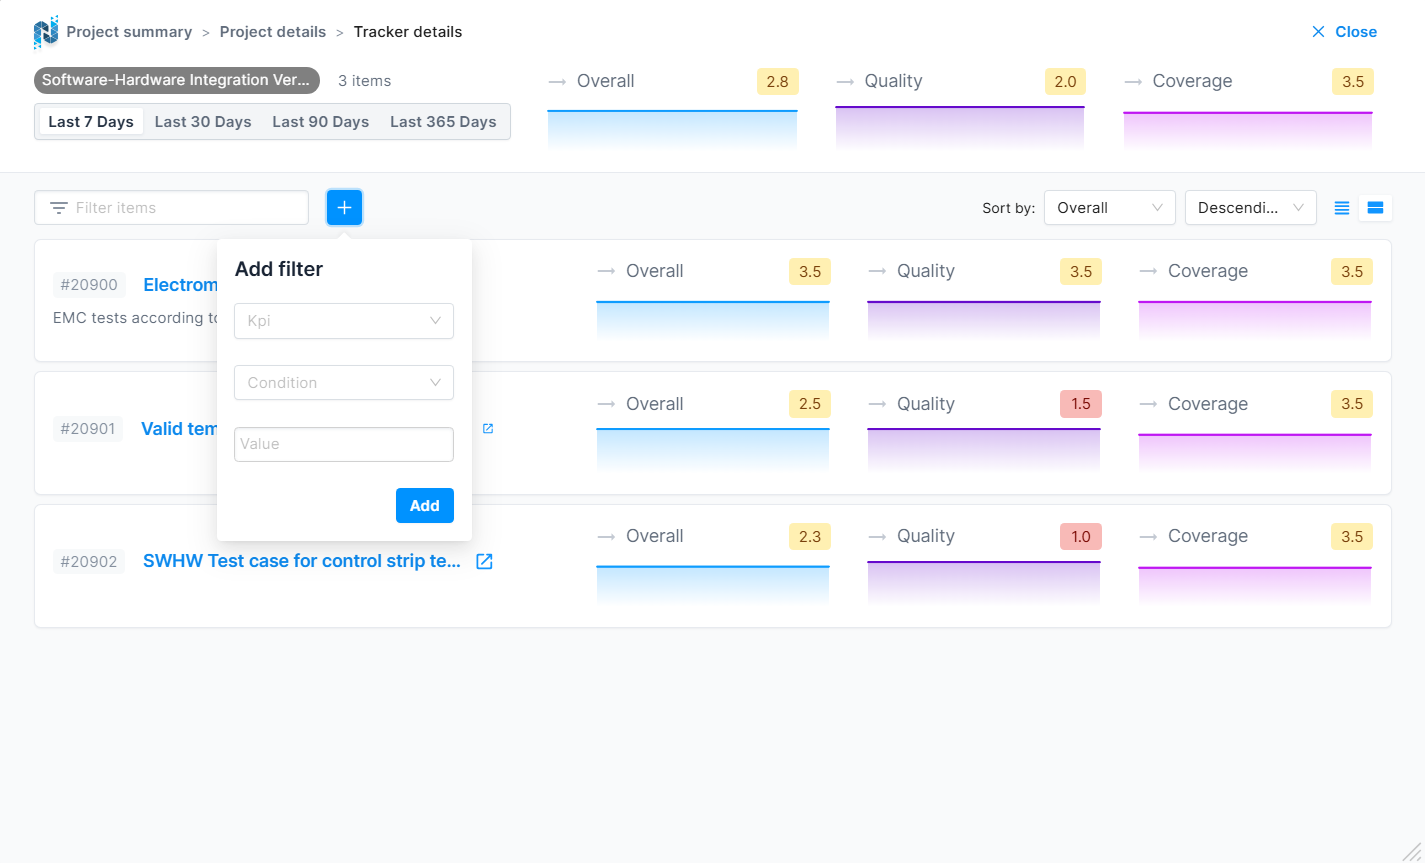
View the resource shape header #
A horizontal header displays:
- Resource shape name
- Number of resources
- Overall score
- Quality, duplicates, and coverage KPIs
- Trend icons
- Color-coded scores
- Historical charts for each KPI
Filter resources #
You can filter resources in multiple ways:
Text search #
- Type in the filter field to match by name, summary, or description.
KPI filters #
-
Click the plus button to add KPI filters.
In the popup:
- Choose a KPI
- Select an operator (greater than or less than)
- Enter a value from 0 to 5
- Added filters appear next to the name filter.
- Remove any filter by clicking the X next to it.
Sorting #
Two dropdowns let you sort by:
- Name/summary
-
Any KPI
Order can be ascending or descending.
View mode #
Use the segment control to switch views:
- Compact: hides per-KPI charts
- Detailed: shows per-KPI charts
View resource cards #
Each resource card displays:
Left column #
- Resource ID
- Title or summary
- Trimmed description
Right column #
KPIs for:
- Quality
- Duplicates
-
Coverage
Each includes:
- Trend icon
- KPI name
- Color-coded score
- Historical chart (visible only in detailed view)
Results and next steps #
The Dashboards give a multi-level view of project quality and performance, from high-level project summaries down to individual resource behavior. Use these insights to monitor trends, identify weaknesses, and maintain strong ALM practices across connected projects.